Alias Visual Search

Company
Alias, a selling platform within the GOAT Group e-commerce ecosystem.
Project Details
Launched and refined a sneaker listing tool to improve discovery, scanning, and listing success across multiple iterations.
Timeline
Phase 1: Jun 2021 - Dec 2021
Phase 2: Aug 2023 - Mar 2024
Role
Product Designer
Problem + Context
Problem
Business Problem
Post-COVID, leadership wanted to differentiate the app and modernize the sneaker selling experience. Sellers were limited to text search, requiring prior knowledge of items and reducing discovery.
Goal
Support sneaker and apparel discovery with ML-powered search
Modernize the selling experience
Differentiate the app in a competitive resale market
Solution
Phase 1: MVP with photo search to validate seller value
Phase 2: Design system updates and usage insights (barcode scanner emphasis) to improve scanning success and seller adoption
Impact
Phase 1: MVP widely adopted; app rating increased from ~4.0 → 4.4
Phase 2: Visual Search now accounts for 13% of searches (up from 5%); UPC scanning ~90% success, image search ~60%
Phase 1: Process

Data Science Collab
Worked with the data science team to determine the optimal number of guesses for sellers → top 4 predictions

Field Research
In-store observations; tested photos at various angles and lighting to validate model performance

Competitive Analysis
Reviewed AR/photo recognition features to inspire and inform interaction patterns
Early Exploration
Photo capture + upload became primary methods; decided image URL could be optional
Placed image alongside results for easy comparison
Used current sneaker templates for ML model accuracy

Initial exploration showing image next to results for easy comparison, leveraging sneaker templates for model accuracy.Iteration
Added feedback loop and “rate the app” CTA
Integrated barcode upload; clarified sneakers vs apparel input
Adopted tab layout and instructional copy from GOAT app inspiration

Refinements based on manager and stakeholder feedback, emphasizing accuracy and usability while addressing multi-product complexities.MVP Final Touches
Simplified UI; removed unnecessary tabs
Prepared copy team for launch
Ensured stakeholder alignment

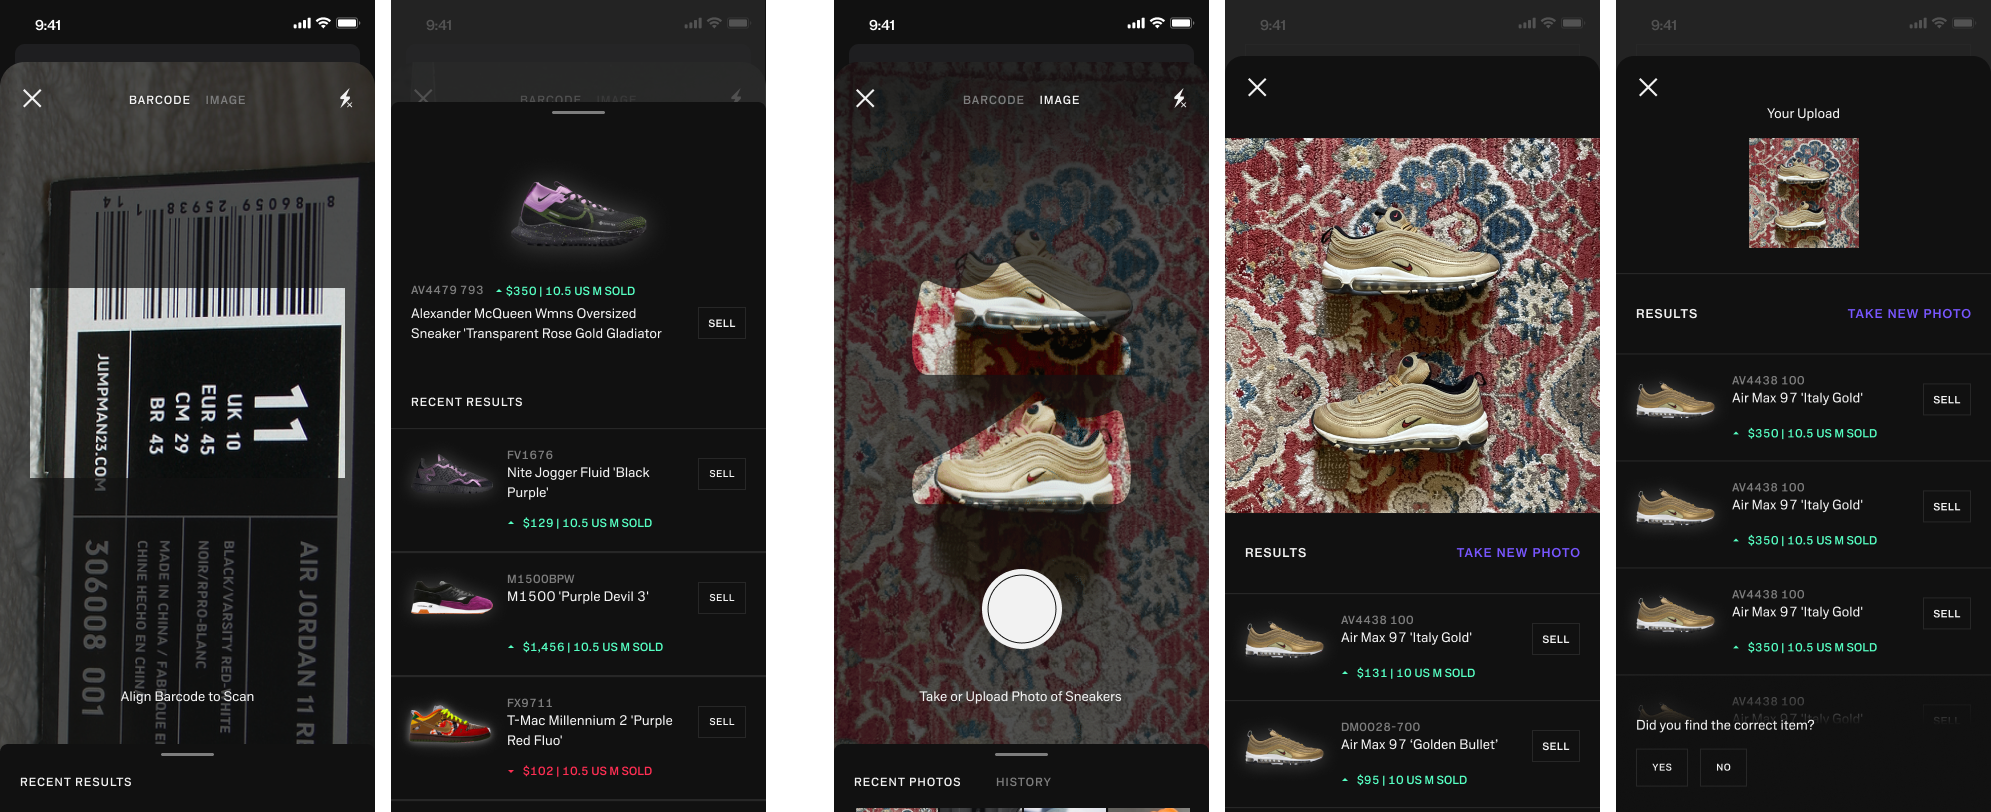
Final refinements to streamline user flow, clarify input guidance, and prepare for launch.MVP Visual Search experience — seamless photo and barcode input with dynamic results and seller feedback loop.Takeaways
Outcomes + Results
QA with engineering ensured accurate implementation
Beta field testing validated happy/unhappy paths
Optional photo harvesting step added to continue training MLM, gaining adoption
Sellers widely adopted MVP; app rating rose 4.0 → 4.4
Reflections
Collaborating with the data science team and testing in the field highlighted the challenge and reward of designing a seamless ML-powered experience for sellers
Lets transition to Phase 2…
As a recently promoted mid-level designer, I took greater ownership and partnered with PM, Ben. Together, we re-examined seller needs and emphasized barcode scanning for sneakers while maintaining photo capture/upload support.
Phase 2: Process
Seller Survey
80% rated Visual Search 4/5–5/5
Secondary use: 24% for price-checking
Main pain point: inaccurate scans
Competitive Research
StockX: validated sneaker photo search standards
Yuka: inspired engaging scan interactions (haptic feedback)

Early Exploration

Structure: barcode scan tab + photo capture tab + results page
Early feedback: add scan line animation, simplify toggle and background gradientIteration
Shifted to barcode scanner primacy
Simplified toggle; refined the new results sheet to match both barcode + image result pages
Feedback: adjust sizing info, improve image spacing, consistent CTAs
Final Design
Execution & Collaboration
Briefed Brand team to create a unique motion asset emphasizing sneakers + UPC scanning
Collaborated with copy team via annotated Figma brief
Prototypes were presented to engineering teams to ensure smooth development, and aided QA teams for support on edge cases
Overall Takeaways
Outcomes + Results
Managed design QA with PM; tracked engineering implementation
Impact Metrics:
Visual Search = 13% of alias searches (up from 5%)
UPC scan success ~90%; image search ~60%
Reflections
Phase 2 allowed me to grow in responsibility, efficiency, and brand-aligned UI thinking
Finally, seeing adoption metrics rise from Phase 1 while delivering a polished, usable feature was incredibly rewarding